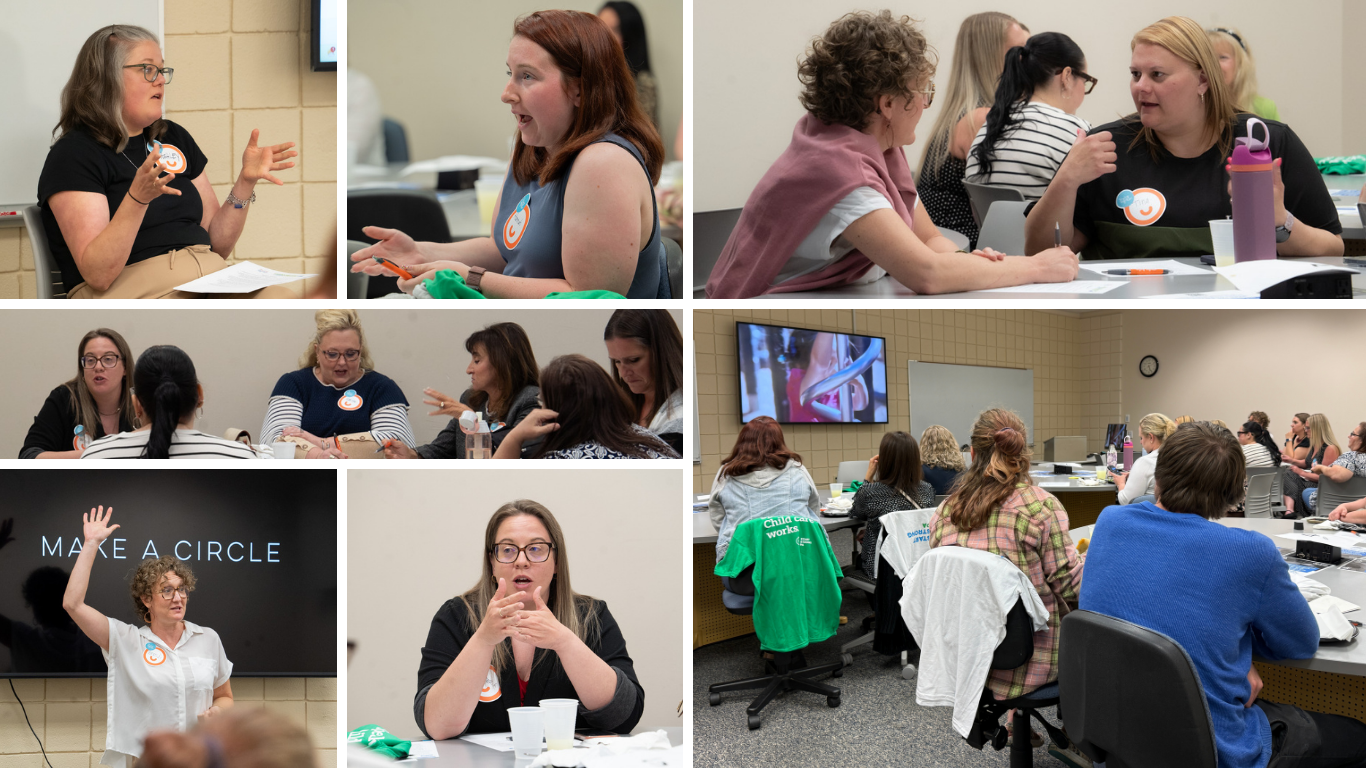
On June 1, Trying Together and Westmoreland County Community College hosted a screening of the documentary film Make a Circle with early care and education teachers, program directors, administrators, and higher education professionals. After dinner and a 60-minute viewing, the group engaged in impactful conversations and shared reflections on a path forward.
About Make a Circle
Make a Circle follows early care and education providers from California, highlighting their joys, challenges, and collective advocacy efforts. The film demonstrates through compelling storytelling how early childhood education is historically undervalued and underfunded despite its critical importance. While the film takes place in California, the stories and universal experiences resonated with the ECE professionals representing Allegheny, Beaver, Fayette, Greene, Washington, and Westmoreland counties who came to view and discuss the film.
Throughout the screening, the audience nodded along in recognition of the challenges, laughed at relatable interactions between children and educators, and shed tears during heartbreaking moments that felt all too familiar.
Group Discussion
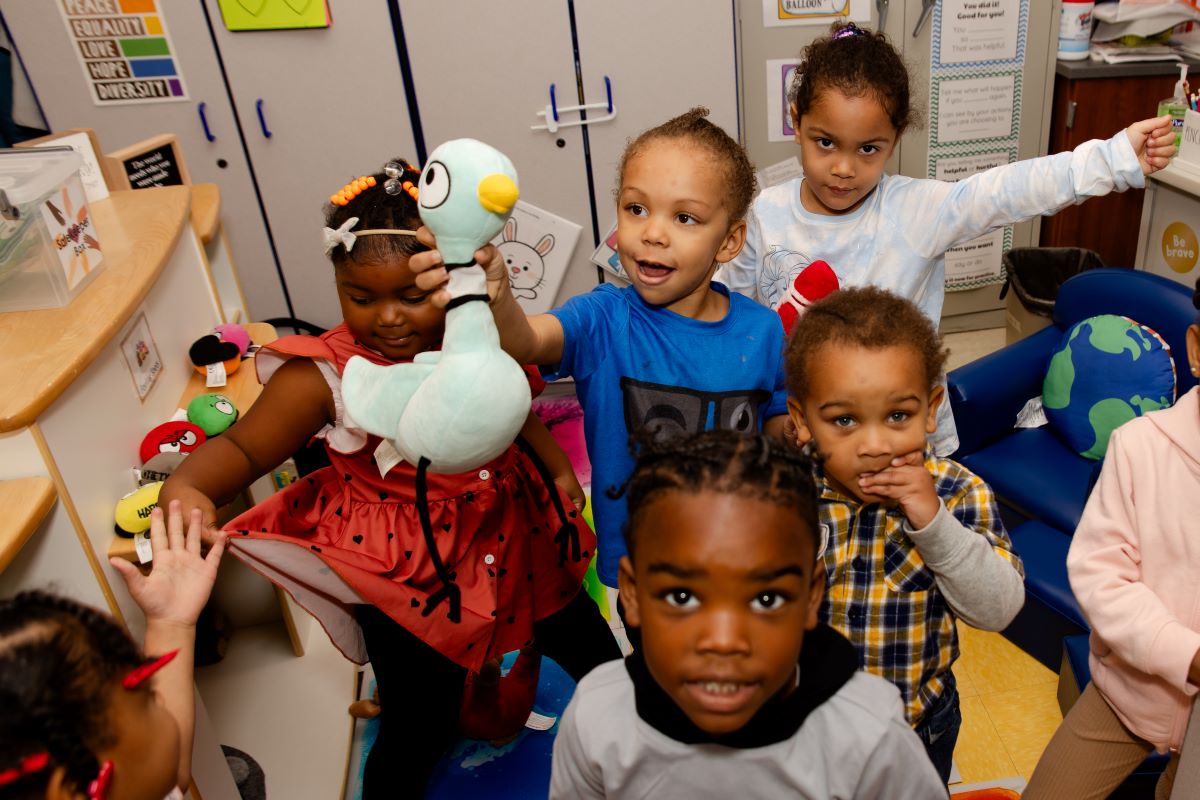
Focusing on the experiences of early care and education professionals in Southwestern Pennsylvania, the group shared their own stories, emphasizing the deep fulfillment that comes from helping children grow, witnessing moments of curiosity, and building the foundation for all future learning.
Despite the joys of working in the field, the group recognized universal challenges: difficulty hiring and retaining staff; the daily struggle to provide coverage; the hard decision to close classrooms; and more.
At the forefront were anecdotes about those who continue to make heartbreaking decisions to leave their passion behind for higher paying jobs, including those in K-12 settings. According to Start Strong PA and PreK for PA, kindergarten teachers in Pennsylvania make an average salary of $64,270 compared to $35,250 for preK teachers and $29,510 for child care teachers.
“I left direct care too because I couldn’t provide a living for myself,” said one participant, reacting to a story from the film about an educator leaving his job in child care because he could no longer afford to remain. “I love working with kids and being in the classroom with the little ones… I miss it a lot.”
While much of the discussion focused on the challenges faced by educators, the group also recognized the difficulties faced by families. Often, parents shoulder a financial burden when child care programs are forced to raise tuition rates. Without public investment, it becomes more and more difficult for programs to keep their doors open. In turn, families lose access to high-quality child care which can hinder their ability to work.
Takeaways
The film highlights the importance of advocacy – from creating spaces to have important conversations and connect with our communities, to organizing and elevating unified messages.
It is unfortunately common for early educators to dedicate multiple decades of advocacy to make small strides in public investments. Emily Neff, director of public policy for Trying Together, encouraged the group to keep speaking up for change. “Persistence matters!”
In the 2025 – 2026 State Budget, PA saw the development of a new early childhood line item for the first time in nearly 20 years. For many early educators, this was a moment of celebration and of feeling heard. The $25 million investment in the new Child Care Recruitment and Retention line item demonstrated that policymakers heard advocate’s voices and took the first step in solving the child care crisis and investing in the workforce.
Last year’s new investment in the child care workforce was an important first step, but there’s still more to do.
“All the work our advocates have done is phenomenal, and we’ve achieved a lot of things,” one participant reflected. “But we’re still in the trenches. We’re not even above water yet.”
Early childhood supporters in Pennsylvania are currently actively advocating for the 26-27 budget to include the proposed investments in the early care and education workforce (at a minimum):
-
- $10M increase for the Child Care Staff Recruitment and Retention Program.
- $2M increase for the Head Start Supplemental Assistance Program.
- $7.5M increase for Pre-K Counts.
The early education professionals who attended the screening ended the evening by completing post cards to send to their elected officials and signing action alerts urging elected officials to invest public dollars in ECE.
As conversations closed for the evening, folks left with a spark of optimism and renewed sense of hope that we can continue to grow awareness of the value of early care and education, along with elevating the need for increasing public investments.